
Creating a Qlik Link Table
Background
Before I dive into the deep end of walking you through the process of creating a Qlik Link Table, I want to share a tiny bit of background.
As I was learning Qlik one of the most impactful things I ever read came from Stephen Redmond‘s “Mastering QlikView” book. I was really struggling to grasp the concept of the AGGR function, which according to so many experts could do all sorts of awesome things. The problem I struggled with, which you may as well, was the fact that the AGGR function does all it’s wondrous things IN MEMORY. You can’t see it and I’m a visual person.
Stephen said something profound to me, that I will soon be sharing with you in this post. On page 275 he explained that this invisible in-memory AGGR function contained nothing more than the data you could visualize in a Straight Table.
🤯 – My mind was blown, and frankly I felt rather foolish for not realizing that sooner. This Qlik guru was basically saying “Dalton it’s ok for you to be a visual person and need to see it first. If you need to do that, on your way to eventually becoming a Qlik Dork, go right ahead.”
Don’t let the fact that this book is over 10 years old and has the product name “QlikView” in it dismay you from immediately placing an order for it, if it isn’t already in your library. Stephen’s writing style is very much like my own. My theme is “Let’s Make it Simple” and that is exactly how he explains everything in the book. Never forget that the engine and scripting language, behind both QlikView and Qlik Sense are the same. This is a book that will help you take your scripting, and data modeling to the next level and I’m sure you will be able to focus on the code, and not the visuals. The reason I’m giving a shoutout for the concept of providing yourself a visual to understand is something I will use repeatedly within this post.
Setup
In my upcoming post, “Visualizing a Knowledgegraph”, I will walk through a struggle that required me to change my data model. The solution couldn’t be obtained without creating a Qlik link table. Not knowing my audiences familiarity with the concept, I wanted to provide this resource that they could refer to, as well an Google searches that they might use. As you scan the web you will find various terms like “link table” or “bridge table” each with it’s own nuances and reasons for creating them. Some are even about performance. They want to eliminate the hops between entities because just as it takes you time to walk the data model, it takes the Associative Engine time to traverse.
For this post, and the hands on aspects of it, I want you to forget about all of the many nuances, and simply focus on the primary goal … the ability to connect all of our Dimensions/Facts keys in one table. While, still retaining all of the values about the Dimensions/Facts in individual tables. There is simply no better way to learn than by doing. To that end, I will be using pure inline scripts to make it easy for you to copy and paste if you would like to walk through the examples to ensure this concept is solidly at your disposal. You will seldom ever need this, but if you face an issue where you will need it, I would like you to know you are prepared and can resolve it.
Before asking you to code the changes to create a “link table” I will be using Stephen’s great advice and asking you to visualize what you will get by simply using a Straight Table. As you will see it is of great advantage throughout the process.
Associative Engine
Many people getting started with Qlik simply think of it as a data visualization tool. So, in the load scripts they simply execute a Select clause against a SQL View. The same thing they would do with any other “visualization” tool. Over time, they learn, and I sure with analysts would as well, that what distinguishes Qlik (both QlikView and Qlik Sense) from everything else, is the Associative Engine. New Qlikkies realize that while they can execute selects against SQL Views, they will continue leaving data behind, and thus missing part of the important organizational story. They begin by bringing in each table individually as I have below. Again, feel free to copy and paste this load script to a new application so you can really follow along and learn. Clearly I have greatly reduced the complexity of the health data below, as well as the number of rows.
Patients:
Load * Inline [
PatientID, Name, Age
1, Dalton Ruer, 60
2, Qlik Dork, 30
3, Stephen Redmond,
];
Encounters:
Load * Inline [
EncounterID, PatientID, Arrival, Discharge
101, 1, 12/2/1999 1:42 PM, 12/3/1999 2:17 AM
102, 2, 12/4/2012 3:17 AM, 12/5/2012 1:08 PM
103, 4, 12/17/2023 9:01 PM, 12/17/2023 10:12 PM
104, 1, 4/12/2003 7:16 PM, 4/14/2003 9:04 AM
105, 2, 7/4/2013 8:27 AM, 7/4/2013 10:15 PM
];
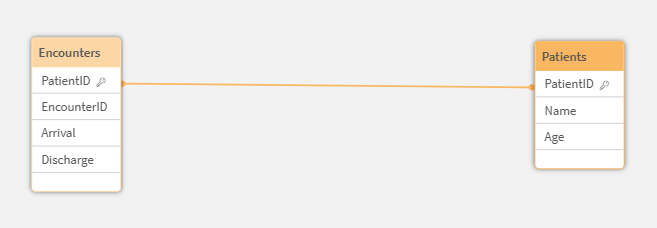
If you go ahead and run this script you will see a very very simple Associative Data Model.
We will have all the Patients and all the Encounters In-Memory, and we can easily refer to either table when we create data visualizations because they are “associated” with each other because the Encounters table contains the key “PatientID” that links it to the proper patient. If you really are just learning about Qlik, to Stephen’s point, you can visualize the associative engine with a simple table visualization. We have a patient with no encounters (visits) which is perfectly natural. Stephen is a healthy guy. But we can also see that we have an encounter with a Patient ID that doesn’t actually exist. Yikes a referential integrity problem. But data is data and all we can do is reflect what the source system contains.
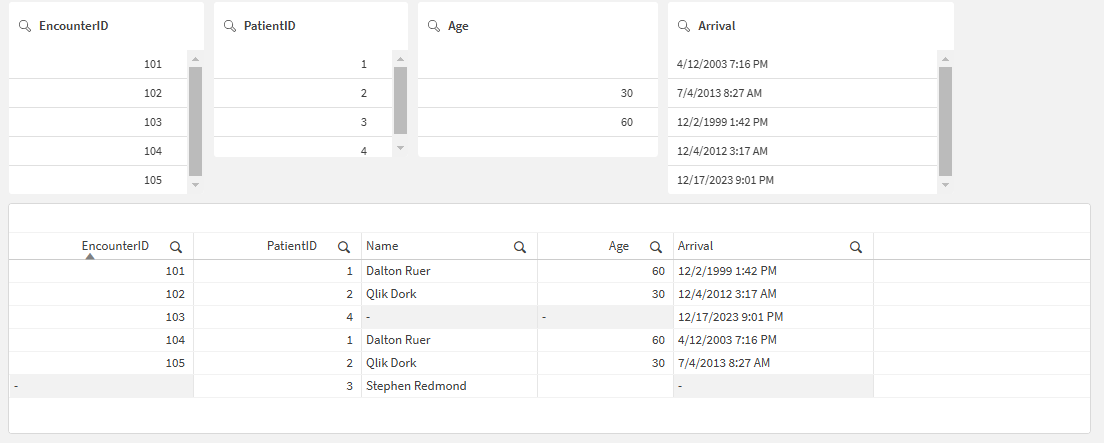
Typical screen showing filters and a table object showing the data we loaded. Not all patients have encounters and not all encounters have patients
A simple selection of EncounterID 102 — reveals the nature of the Associative Engine itself. In the table we only see what the SQL View would return if we asked for Encounter 102, while the filters show you that all of the excluded information is still in memory. It’s just excluded because of the filters.

Typical filters and a table reflecting the status of the Associative Engine after selection(s) are made
Link Table
For the sake of your time I will move on to how to use a Link Table in our Data Model, but wanted you to understand why so many do stop at the above form of data modeling. It provides everything they ever dreamed of and more. As I started I have another post where I explained a really complex scenario where this form of just purely relying on Associations between all of the tables didn’t work. I needed something where all of the “facts/ID’s” existed in a single place … a “link table.” I’ve very seldom ever come across this need, but absolutely did in this case. 95% of the time you won’t need to do, what we are about to do … but when you do, you will now be prepared.
Before we go through the coding to create it … I want you to visualize what our “link table” should look like so create a table object and simply include the PatientID and then include EncounterID. Not only is a Table object good for visualizing what to expect from AGGR statements, it’s ideal for seeing the relationships/links managed by the Associative Engine:
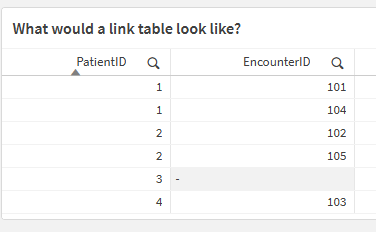
Simple Table object with values we would expect to see when we create a link table that contains the keys to our facts
Coding a Link Table
Coding this is pretty straightforward. The first thing you want to do is simply populate the table, in the same way you built the visual table. You include all of the patients, then you “join in” to include all of the encounters. Go ahead and replace your code with the following and load the data.
Patients:
Load * Inline [
PatientID, Name, Age
1, Dalton Ruer, 60
2, Qlik Dork, 30
3, Stephen Redmond,
];
Encounters:
Load * Inline [
EncounterID, PatientID, Arrival, Discharge
101, 1, 12/2/1999 1:42 PM, 12/3/1999 2:17 AM
102, 2, 12/4/2012 3:17 AM, 12/5/2012 1:08 PM
103, 4, 12/17/2023 9:01 PM, 12/17/2023 10:12 PM
104, 1, 4/12/2003 7:16 PM, 4/14/2003 9:04 AM
105, 2, 7/4/2013 8:27 AM, 7/4/2013 10:15 PM
];
LinkTable:
Load PatientID
Resident Patients;
Join (LinkTable)
Load PatientID, EncounterID
Resident Encounters;
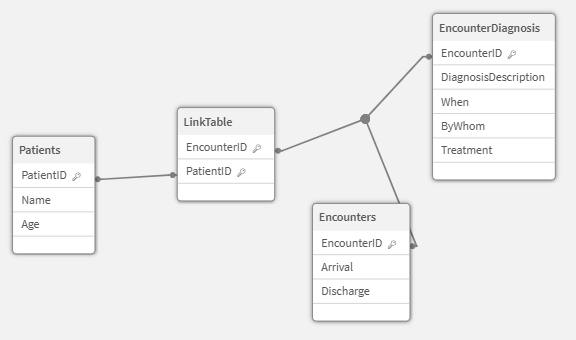
Synthetic Key
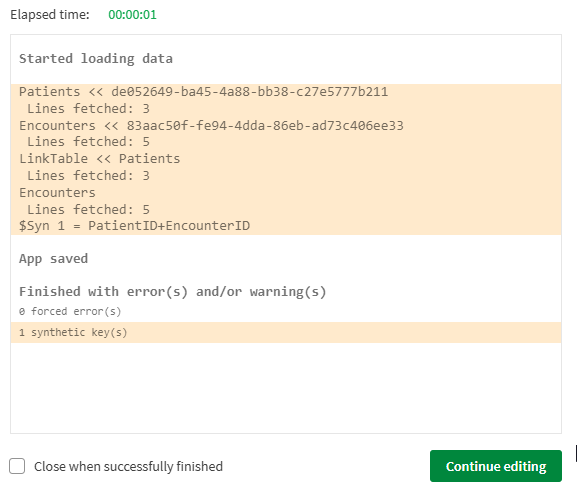
Well cruddy crud crud. The fact that we now have both PatientID and EncounterID in the Encounters table, as well as our new link table has caused a Synthetic Key.
We are trying to simplify things, not make them look even more complicated and confuse everyone if they look at our Data Model.
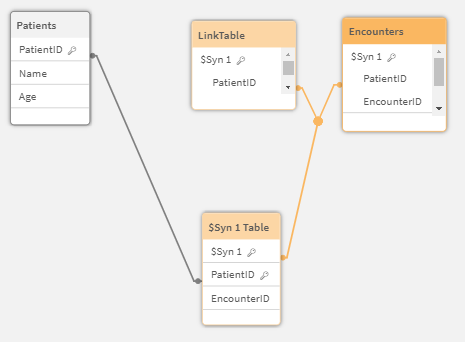
Data Model Viewer showing the Synthetic Key problem that arises if multiple tables contain an association for multiple field names instead of just one
We can avoid the Synthetic Key by simply adding a single line of code at the bottom of the script
Drop Field PatientID From Encounters;
I could have added that initially, but let’s face it … you would have wondered why in the world it was there. Now you know, and when you see an issue in the future you will be reminded how to resolve it. 😂
Link Table Data Model
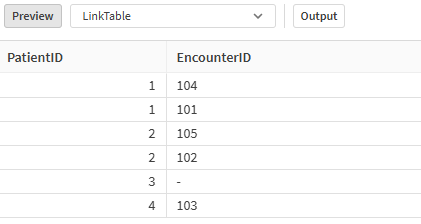
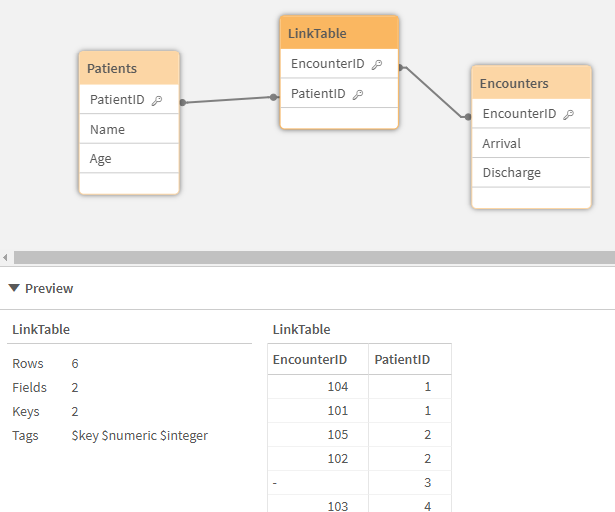
Go ahead and load the data. After reloading your script you will have the following data model. The Data Preview at the bottom of the script editor reflects exactly what we visualized as our target.
If you were to look at the Data Model view, you would see that we now have a clean data model. One in which both tables still maintain their “key field”/”ID” so we can access all of the values for any specific Patient or Encounter. The biggest difference is that the LinkTable now contains the relationships between the Patients and the Encounters that they had.
More Complexity
Now let’s add some more data into our application. Let’s face it … two tables seems like a weak example. But since my goal is to make things simple, it was an easy way to start without the need to become overwhelmed. In my post about Visualizing a Knowledgegraph I used an illustrate with a ton of tables. Don’t worry I won’t have you add the hundreds of tables that we might really need in Healthcare, we will just add two more. We have a table of Diagnosis codes, problems that patients can have. On any given encounter, a patient might be diagnosed with 1 or more diagnosis codes. The diagnosis would happen at some time, and be diagnosed by someone and someone treatment might be prescribed to take care of the issue. So, let’s add those to your load script and load the data.
Diagnosis:
Load * Inline [
DiagnosisID, Diagnosis Description
999, Mountain Dew Addiction
998, Snicker Bar Addiction
];
EncounterDiagnosis:
Load * Inline [
EncounterID, DiagnosisID, When, ByWhom, Treatment
101, 999, 12/2/1999 3:07 PM, Doctor 1, Big Gulp
101, 998, 12/2/1999 3:08 PM, Doctor 1, King Size Snickers
102, 998, 12/5/2012 11:13 AM, Doctor 1, Baja Blast IV Injection
104, 998, 4/13/2003 7:13 AM, Doctor 2, Double Gulp
];
Go ahead and add that script, at the bottom of your code and do a reload. You will see that your data model should now look like this. While you could live with this hybrid, Link Table model mixed with pure Associated Model, we want to change it.
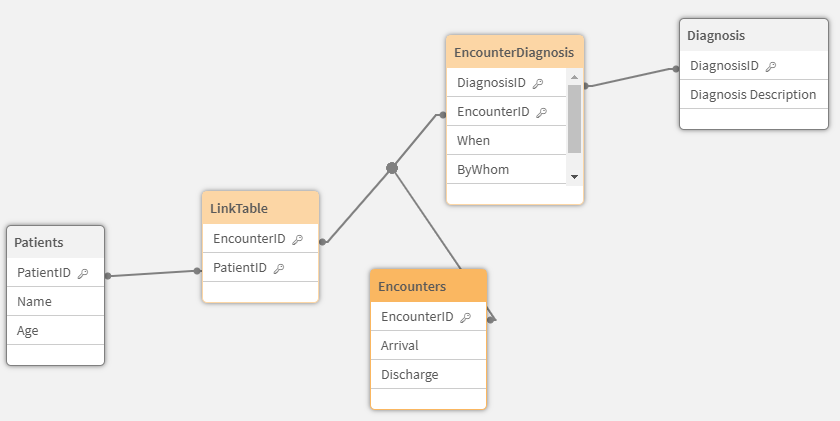
Data Model Viewer reflecting that the Diagnosis table and the table showing which Diagnosis were made on each Encounter
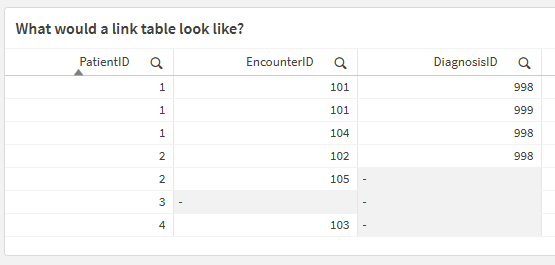
Naturally we want that Encounter Diagnosis information to be part of our LinkTable. Before we try to build it, let’s imagine what that would look like, by simply adding the DiagnosisID to our simple Table object:
Don’t you love visualizing the goal before trying to do all the mental gymnastics for something you can’t see? Good thing it’s super simple to do. Go ahead and add the following and do a reload. Notice how I was a nice guy this time, and helped you avoid the Synthetic Key that would have been created had you not dropped the EncounterID field from the EncounterDiagnosis table. 😁
Join (LinkTable)
Load EncounterID, DiagnosisID
Resident EncounterDiagnosis;
Drop Field EncounterID from EncounterDiagnosis;
Yeah! A simple Preview at the bottom of the load script reveals that we met our goal. I guess we are done and should head to an early lunch.
Not so fast
Just for giggles and grins, let’s go ahead and add some of that new information to a simple table just to make sure our users will have what they expect.
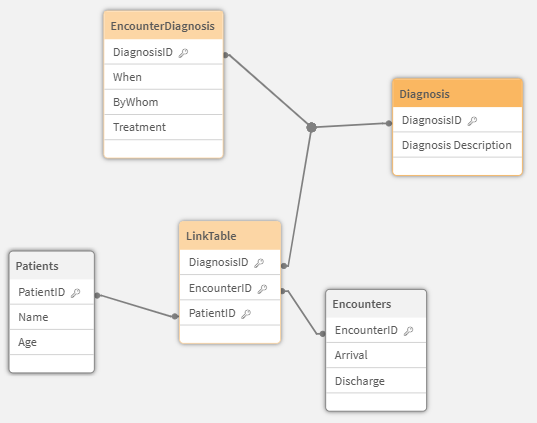
Well that’s certainly not right. Each combination of Patient and Encounter for Dalton Ruer and for the Qlik Dork show all of the diagnosis information from all of their encounters.
I don’t get it!!!!! Our LinkTable reflected exactly what we previewed in a Table object we should have been fine. Right?????
So, what happened? Always remember … the Table object shows the DISTINCT values of the dimensions you choose. Our preview table only contained the PatientID, EncounterID and DiagnosisID. Even though the LinkTable itself now shows the right distinct values that we expected. And our Data Model Viewer looks super clean the problem was a logic one.
The “Key” for the EncounterDiagnosis “fact” isn’t really EncounterID or DiagnosisID. It’s really both. But we treated it as though it was only the DiagnosisID. Creating a Cartesian product where all Encounters display all of the new Encounter/Diagnosis information.
Resolution(s)
Better order in lunch, or grab a Snickers bar because we need to resolve this. There are really 3 distinct methods we can take to resolve it.
Option 1
Simply go back to the hybrid model, where we do nothing with Diagnosis and the Link table at all. While it avoids the Cartesian issue, and gets us to lunch right away … please don’t do this.
Option 2
If your end user tells you “I will never, ever, in a million years need to see Diagnosis information other than as it relates to Encounters” … then you are free to greatly simplify things. You can simply load the Diagnosis information as a Mapping Table, and then use a Preceding Load and do ApplyMap for the EncounterDiagnosis table.
Since EncounterID is already a part of the LinkTable … we are good to go. Right?????
Option 3
The reality is that option 1 simply kicked the can to let us grab lunch, but now we need to resolve it. Whenever you know you are simply doing something in a hurry, experience will prove that you will spend more time and have more headaches in the future if you do it right.
I prefaced Option 2 with “your end user said never, ever, in a million years” which we all know really translates to “until next week when I change my mind.” Besides, it is somewhat misleading to have the EncounterDiagnosis information associated by EncounterID. Because as mentioned … the real “fact” key for EncounterDiagnosis is actually a concatenation of the EncounterID –AND– DiagnosisID. We neglected to deal with that. A “fact” KEY needs to be unique. PatientID’s are unique and point to a single patient in the Patient Table. EncounterID’s are unique and point to only 1 Encounter in the Encounter Table. Yet the EncounterDiagnosis is actually linked in a 1 to many manner.
Do it right the first time
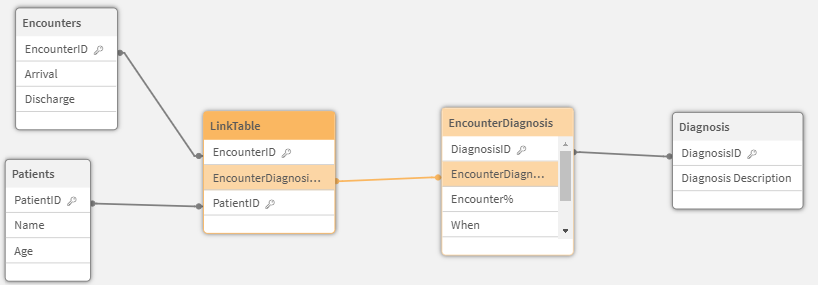
So, now let’s actually deal with the issue in the way it should be dealt with all along. Ensuring that our LinkTable contains all of the relevant FACT KEYS in a 1 to 1 manner. Since our EncounterDiagnosis is really “keyed” on EncounterID and DiagnosisID we need to concatenate them. This is one of the “nuances” I mentioned you would find if you search for the topic. Notice that I’m using a preceding load for the EncounterDiagnosis table. We would NOT want the table to actually contain the EncounterID field so we simply alias that field. We could also ignore it all together.
Next we concatenate the EncounterID and the DiagnosisID to form the real concatenated key that the data should likely contain.
Finally we want to add that concatenated key to our LinkTable.
Creating a Qlik Link Table Summary
95 times out of a 100 you can accomplish your visualization goals by simply using the Associative data modeling directly, and never need a Qlik Link Table.
In my other post, on Visualizing a Knowledge Graph, the problem was that I did in fact HAVE TO use a Qlik Link Table. And realized that when I wrote it, I needed this post as a primer for those who have never implemented one.
The absolute “KEY” to remember when creating Qlik Link Tables is that they should link to all of your “facts” in a 1 to 1 manner. If you always focus on that thought, you will avoid a lot of other issues introduced. If you need a concatenated key field to do it … then just create it as part of the data load.
While you may never need it, hopefully, you are now armed with a new skill or two. As well as what is one of the best books ever written (in my opinion) to help you add even more skills to your repertoire.
Study Guide
I’m going to try something I’ve never done before as an additional way to help those who are really trying to grow their skills by providing this study guide section. I will provide some questions about the material, as well as the answers to them if you scroll further.
Questions
- What is the primary function of Qlik’s Associative Engine?
- Why might a simple SQL SELECT statement be insufficient when loading data into Qlik?
- Describe the situation in the source material where a referential integrity issue was encountered.
- What is a Qlik Link Table and what is its primary purpose?
- What issue arises when both the Encounters table and the LinkTable contain both PatientID and EncounterID?
- How can the synthetic key problem be resolved?
- Explain the Cartesian product problem that occurs after adding the Diagnosis and EncounterDiagnosis tables.
- What are the three options presented to resolve the Cartesian product problem?
- Why is Option 2 (using a Mapping Load and ApplyMap) potentially problematic?
- Describe the “Do it right the first time” approach (Option 3) and why it is considered the most robust solution.
Study Guide Key
- Qlik’s Associative Engine enables the exploration of relationships between data in memory, allowing users to make selections and see how those selections impact other data points across various tables.
- A simple SQL SELECT might not capture the rich relationships between data tables that Qlik’s associative engine leverages. It might also leave out data that is important for understanding the complete story within the data.
- The source material shows an encounter record (EncounterID 103) linked to a non-existent patient (PatientID 4), highlighting a data inconsistency.
- A Qlik link table is a central table containing keys from various fact tables. It serves to establish connections between different data elements and simplify complex data models.
- The presence of the same field combination (PatientID and EncounterID) in both the Encounters and LinkTable leads to a synthetic key issue, creating ambiguity in the data model.
- Dropping the redundant field (PatientID) from the Encounters table resolves the synthetic key problem, ensuring a clear and unambiguous data model.
- Adding Diagnosis information without a proper key results in a Cartesian product where each Patient/Encounter combination incorrectly displays all diagnoses. This occurs because the distinct values shown in the initial preview table don’t reflect the actual relationships in the data.
- Option 1: Revert to a hybrid model (least desirable), Option 2: Use Mapping Load and ApplyMap (potentially limiting), Option 3: Concatenate keys for accurate representation (most robust).
- Option 2 relies on the assumption that users will never need to analyze unused Diagnoses, which might prove inaccurate in the future. It also creates a misleading association based on EncounterID instead of the combined EncounterID and DiagnosisID key.
- Option 3 involves concatenating EncounterID and DiagnosisID to form a unique key for EncounterDiagnosis, ensuring a 1-to-1 relationship in the LinkTable. This accurately reflects the underlying data structure and prevents future issues.




Beautiful post, a must read!