
Dynamic Views in Qlik Sense SaaS

I need more data
We’ve all said that before. More importantly, we have all heard that from other users before. Well let’s imagine that your healthcare system users have access to 185 million rows of data. Patients. Encounters. Medications. Medications. Etc. They have it all. The data for the entire process. Clearly those users wouldn’t need or want more would they?
Ring-ring-ring … “I need access to our billions and billions of rows of claims and claim transactions.”
Oh-no that’s a lot of data you think to yourself! But you stay calm and you tell the user you will consider that.
You barely hang up the phone than a clinical researcher appears at your cubicle.
“I realize you are using incremental loads for the medications every 10 minutes, well that isn’t good enough for me I need to know I’m looking at up to the second values.”
“Ummmm live values whenever you want it? Sure let me think about that.”
How will you provide the access?
The question isn’t if they will want more, we will know they will. The real question are given that “you think of Qlik” as being an in-memory tool:
- “How will you provide the access to their giant data sources.”
- “How will you provide live access to their rapidly changing data sources.”
On Demand Application Generation
Years ago Qlik introduced On Demand Application Generation (ODAG for short) as a way to provide a bit more flexibility for responding to our end users wants and whims. Cases just like that.
Use cases where you need access to what could be gajigabytes of data, and you need it right now. Creating an On Demand Application is just like creating any other application. Select fields from Claims_Transactions. With the exception, that the LOAD script is modified to only read the data based on the values passed to the application. In other words your user does traditional analysis given the data above and finds a patient(s), selects the value(s), presses a button and the value(s) are passed to the ODAG application “Select fields from Claims_Transactions for Patient1″ and the reasonable amount of data is loaded from the gajigabytes of data right then and the user is transferred to that ODAG application.
But what about that live data access for the medications? Here’s the wonderful thing … it’s the same pattern but instead of “Select fields from Claims_Transactions for Patient1″ the application load is “Select fields from Medications for Patients 1,2,100,393.”
You gotta love that. They want more. They want it live. You spend a day or 2 building the ODAG application and making it fancy smancy for them and you deliver it like a champion.
Dynamic Views
Dynamic Views provide a slightly different form of ODAG that I really like. It’s similar in that you still build another application, called a template app, but you don’t need to build a fancy smancy application.
You only need to build the charts they need to see that data and it doesn’t matter if you literally just slap them on a screen without even providing a sheet name.
That sounds odd, but here is the beauty … your end user will be visualizing the charts in the application they are already in, they won’t even see this “ugly” application.
Why do I like that? Because as I always say “Context is King.” If the user has filtered based on a bunch of analysis, Dynamic Views provide the ability to visualize that data pulled live, external to the application itself, but right there alongside the charts they are currently looking at. Here is a bonus, if they are looking at a Dynamic View and they change their selections, they will see a warning sign that the data doesn’t match their current filters. They can choose to refresh so that it does match the new filters, or they can click a button to re-apply the old selections that were used when the Dynamic View was last refreshed.
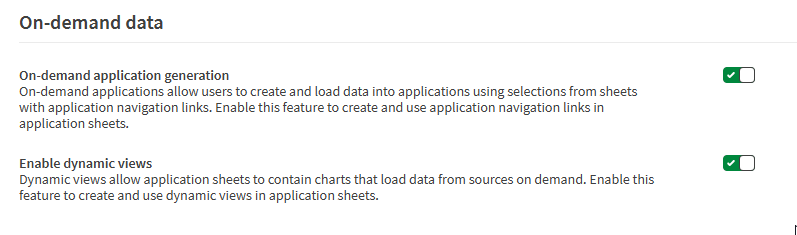
Step 1: Enable it
Enough of the options and background information. Let’s jump right in to how to enable Dynamic Views in your SaaS tenant. You will need to go to your Management Console, and choose Settings. Scroll through the settings and you will need to ensure that both “On-demand app generation” and “Enable dynamic views” are enabled.
Step 2: Building an Application that can be called for ODAG/Dynamic Views
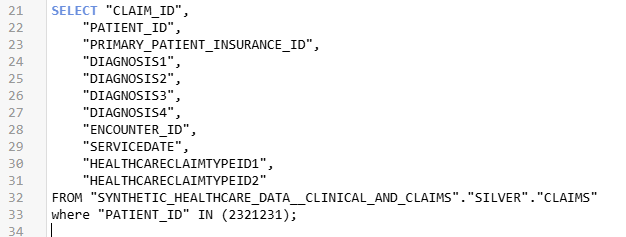
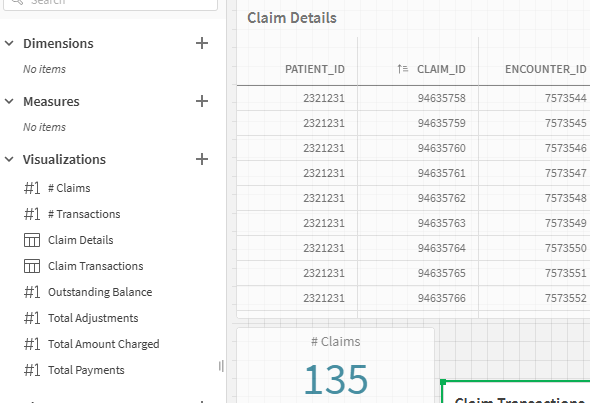
For my example, let’s imagine that my end user through whatever analysis they did wants to see the Claims and Claim Transactions for Sid Murphy.

When ODAG was first introduced the coding was admittedly pretty complicated. For many, it was a very overwhelming. The good news.
Ok I should say “great news” is that it has been rearchitected and is super simple. How simple you ask?
This simple … you simple replace the patient id “2321231” from the image above with a handy dandy variable “odag_PATIENT_ID” and dollar sign expand it like this:
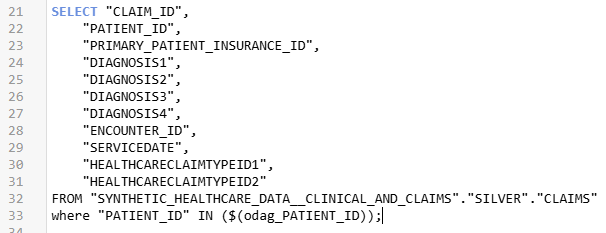
Now that is magnitudes of order simpler than the original method.
How do I test the load if I end up having issues?
Great question! Glad I pretended you asked, just in case you weren’t thinking that. Because you don’t see the typical load script completion notice or error because the Dynamic View will run in the background … you will just end up seeing an error. So here is a handy dandy little tip for you. You can check the system variable to find out if the application is being loaded as an ODAG application and if the value is blank, you can set the od
So that you can then see the failure … some goof ball either changed the Snowflake table and the field isn’t called
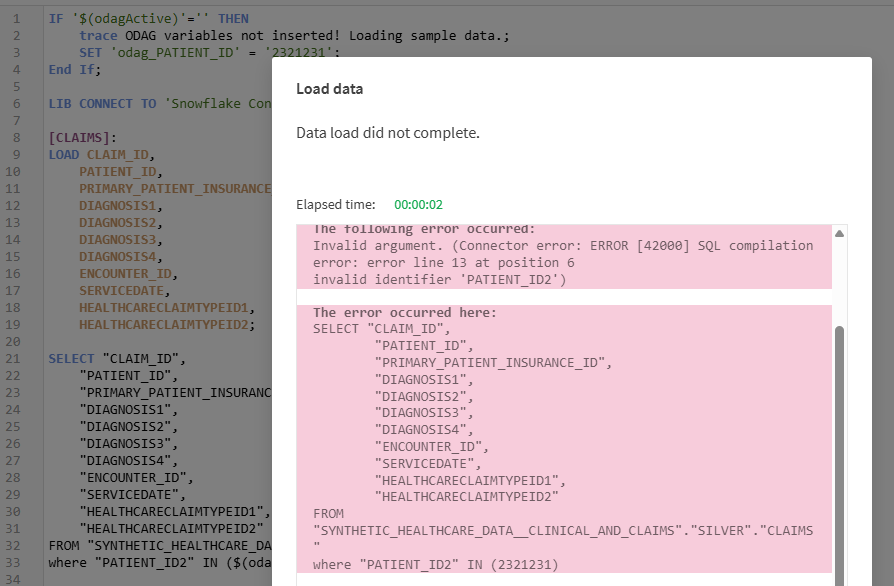
After verifying in Snowflake, you realize that someone did in fact change the field name in the application for some reason (like creating a screenshot) so you correct the where clause and voila success again.
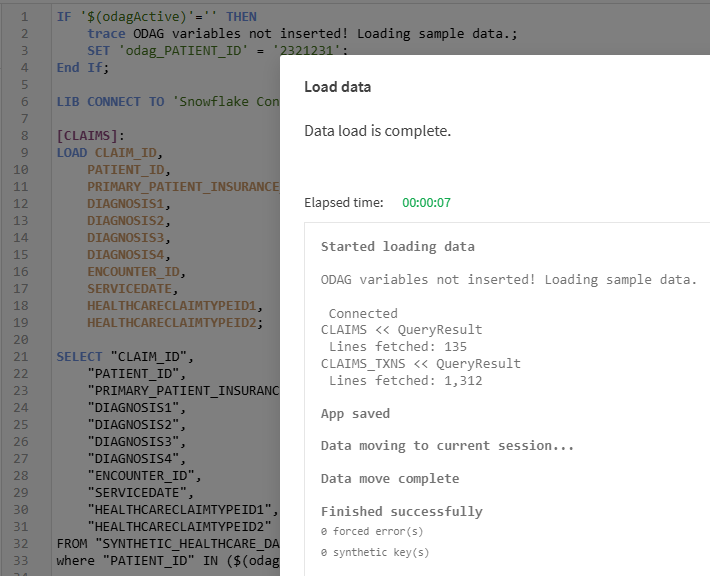
This nifty little tip also allows you make changes to the load script for additional fields when needed as well. After all you do need some data to be in-memory in order to add the fields to charts.
Maybe you are thinking … this is all great Qlik Dork but what if sometimes my users want:
- To see the claims for Encounters instead of Patients.
- To see the claims for Medications instead of Patients.
- To see the claims for only certain Encounters for a Patient.
- To see the claims for patients that are optional based on other selections, but aren’t actually selected themselves.
No problem. You simply build 1,393 of these template ODAG applications to handle every possible case they ever dream of.
We got you covered. Qlik provides a way for handling alternatives and it’s all documented.
Step 3: Creating the Charts to be used
This step is also easy. Just create any type of charts that you want to utilize and then simply make them Master Visualizations.
Step 4: Create the Dynamic View
In our calling application, Synth Hospital, you simply go to Edit mode, and choose Dynamic Views. Then press Create New.
A dialog box will appear and all you need to need to do is provide a Name, and choose the Template (ODAG) app from the dropdown list. Being super creative I’ve called mine “Synth Claims” and the template app I built in steps 2&3 I called “Synth Dynamic (Claims).”
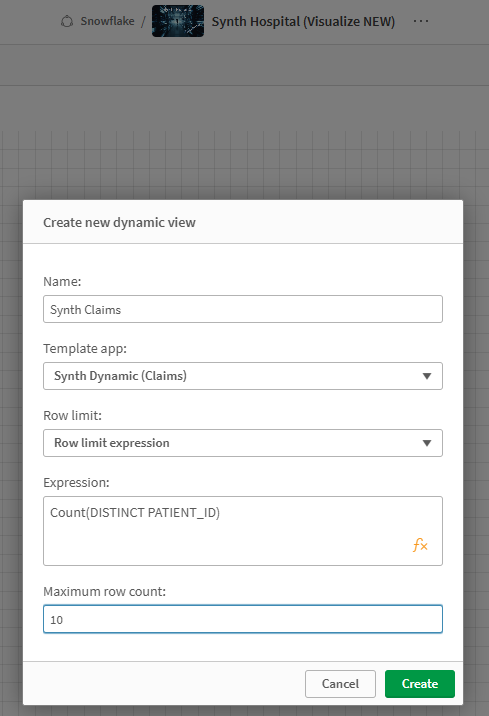
When it comes to Row Limit you can choose from None or Row Limit Expression, which is what I chose. None simply means that the data source you are calling is small and you just need to provide the user the ability to read it live and you simply don’t care if the end user has filtered anything or not. In my case, you know that gajigabytes of Claim and Claim Transaction data, I did want to ensure that my end user selected something.
What limit should I set?
You would determine your limit based on the time your end users will be willing to wait for data to be loaded. Of course that will depend on your network bandwidth and data source.
Finally press “Create” and you will have created your first Dynamic View. Yeah!
Step 5: Drag and Drop
Hopefully that doesn’t sound too intimidating. 😀
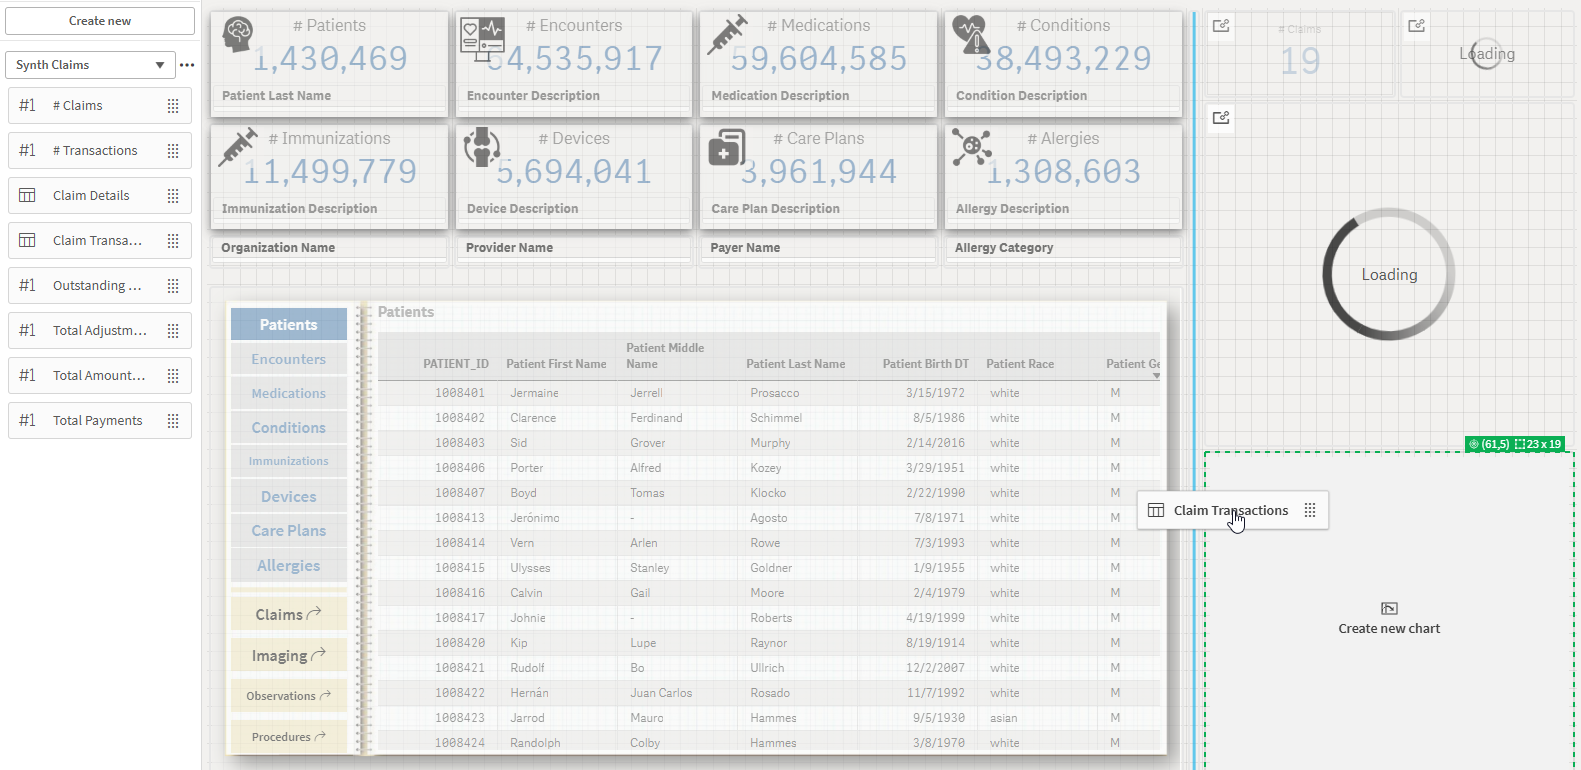
But that’s it my friends, after you have created the Dynamic View it will then display the Master Visuals you created in Step 3 and all you need to do is Drag and Drop the ones you want to utilize in your app onto your canvas.
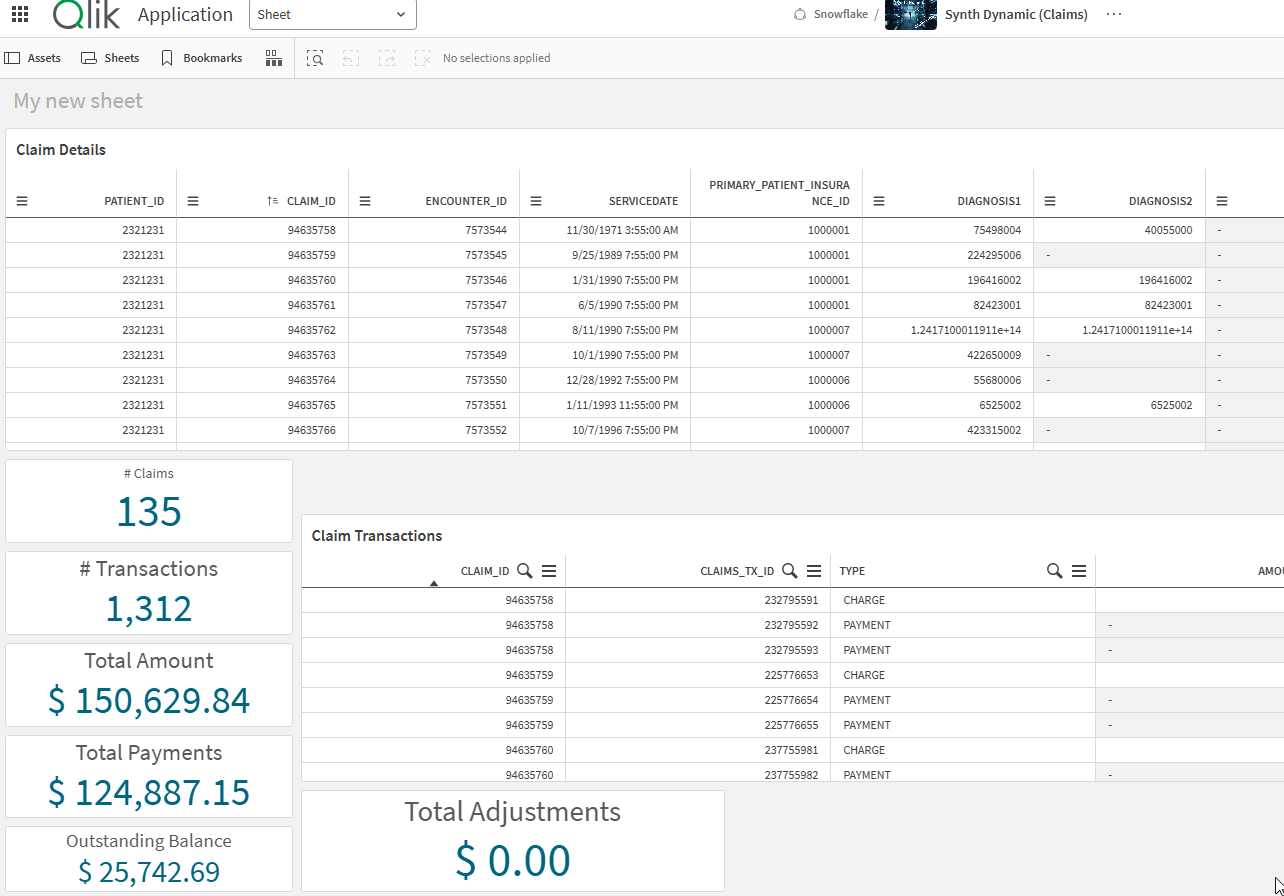
Step 6: Take it for a Spin
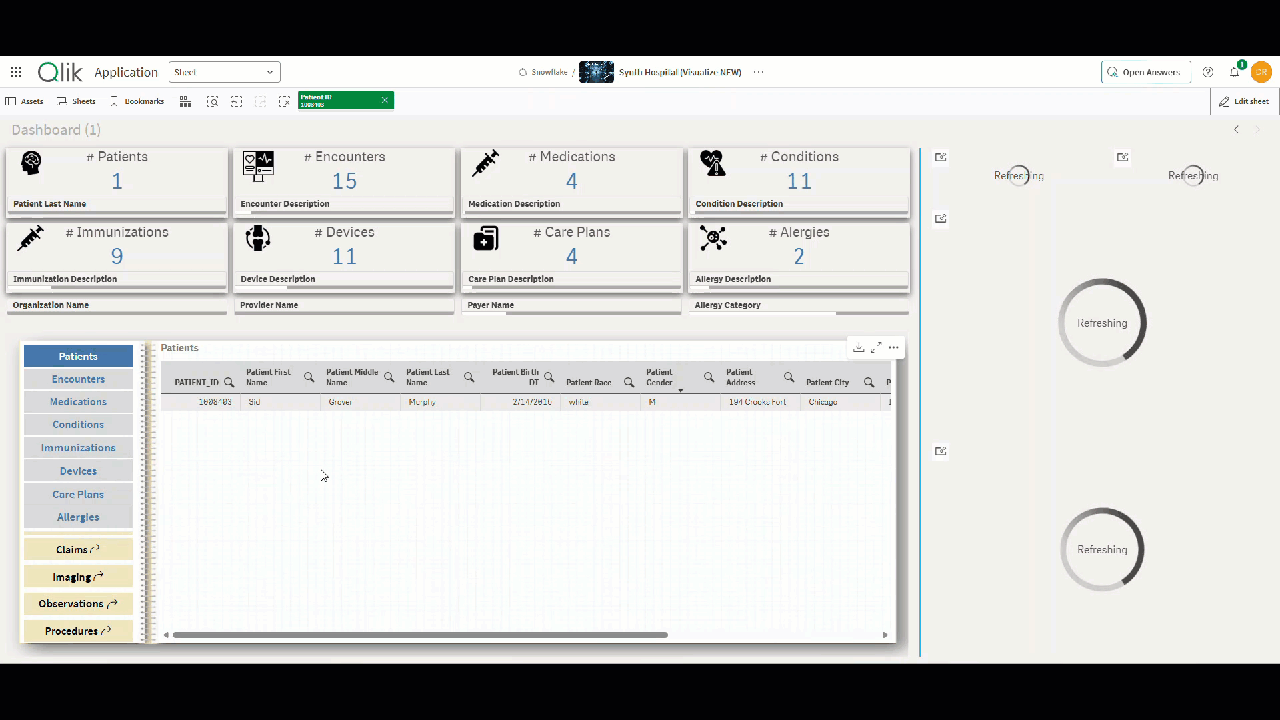
In this animated GIF you will see that after having selected some values I simply press Refresh and the KPI’s and Details are now included.
Summary
A few simple steps and I’ve now provided the ability for my end users to access all that gigantic data, or that data they absolutely have to see live. The best part is, you can as well.
If you were not aware that Qlik provided this simple and elegant form of providing users access to data on the fly, I sure hope you will consider Dynamic Views in the future.
If you were aware of Dynamic Views but had been afraid of the old style of coding that was required for ODAG templates, I hope you will reconsider their use because it really has become so much easier.
If you have been using ODAG and Dynamic Views in your Windows environment, I hope this brief post confirms what you were hoping to hear. That all this wonderful functionality is available in Qlik Sense SaaS as well.
Why so much hope? Because if there is one thing I know for certain, your end users are going to ask for more data and I want you to succeed in giving it to them.
Nice post and explanation. I see a potential with ODAG & DV to handle big data. Only down side with Dynamic Views is I don’t see an option for end user to export the data.