
Flipping Homes or just Flipping Out?

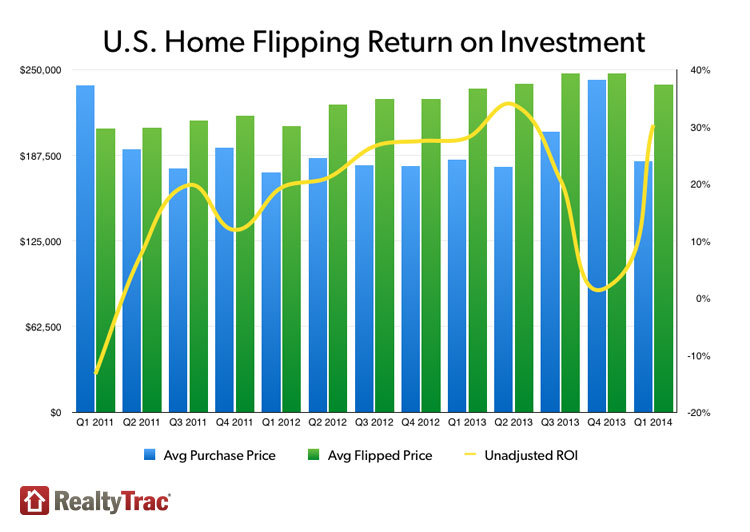
I’ve enjoyed my career in Business Intelligence but after seeing the following visualization which shows the amazing potential for earning profit in the home flipping business I think it’s time I became a real estate mogul.
 Unless you’ve been under a rock or you are probably aware of the blitz of television shows dedicated entirely to showing us how easy it is. The underlying needs for house flipping is the startup capital to make purchases with, and the keen eye of a designer to help you choose the right colors to slap on the walls. I’ve got like $12 saved up which is probably more than enough to get started and fortunately I’m blessed with a wife that has a great eye for design. If you aren’t as fortunate as me you may need to find a business partner and a designer who you will more than likely have to pay.
Getting started
As business intelligence professionals I think it’s only good common sense for us to get started by playing to our strengths … use analytics to help us make our home purchases. After all as advocates of actionable intelligence certainly we would trust our own life savings in our analytical hands. Right???
The first thing we would want to do is figure out what aspects of a home are most responsible for attracting the highest price. Those data science types call what we are trying to do a “multiple regression.” In real estate mogul language it means – “Hey dingbat before throwing all $12 down on the table to buy a home you probably need to know whether it’s the homes square footage or the lot size or the number of bathrooms or the number of bedrooms or the amount of taxes or the proximity to schools that has the most impact on the sales price.”
Multiple Regression
Not too hard to understand the importance that knowledge would have on our ability to turn a profit. But how does that data science multiple regression stuff? It’s simple you fire up R, load your data, you run the LM function and let it give you the answers.
Seriously it’s that easy. Here is how we would load our previous home sales data:
Housing = read.table(“C:/RealEstateMogul/housing.txt”, header=TRUE)
Then if we want R to tell us what the correlation is between the Price of the home and the Size (of home) and the Lot (size) we simply type the following
Results = lm(Price ~ Size + Lot, data=Housing)
Iterating combinations
R very well may tell you that there is a really strong correlation between the home size, lot size and the price. But unless you are lazy you would probably also want to know if there is an even stronger correlation. In other words is the size of the home and the number of bathrooms more important? Or perhaps lot size and number of bedrooms? In our case all we would have to do is go through every possibility of 2 variables. Then all combinations of 3 variables. Then all combinations of 4 variables. Then all combinations of … you get the idea.
As you can imagine it’s this manual coding of all of the combinations, this grunt work, that those data scientists don’t really enjoy. Fortunately as a budding tycoon I’m also a Qlik Dork and I have full intentions of using QlikView as well as R.
QlikView and R Integration
You see this is kind of the perfect use case for the QlikView and R integration. Not only do I want to be able to simply check whatever combination of variables I want to use, I also want to be able to filter the data and choose what is passed to R. That way I can verify the best combination of variables as well as confirm that the correlation holds true across time periods, across zip code ranges etc. Or I may determine the variables that are best suited to 30542 versus 90210.
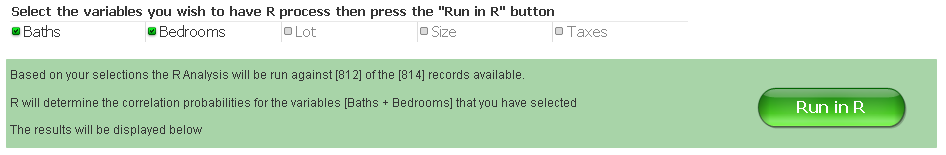
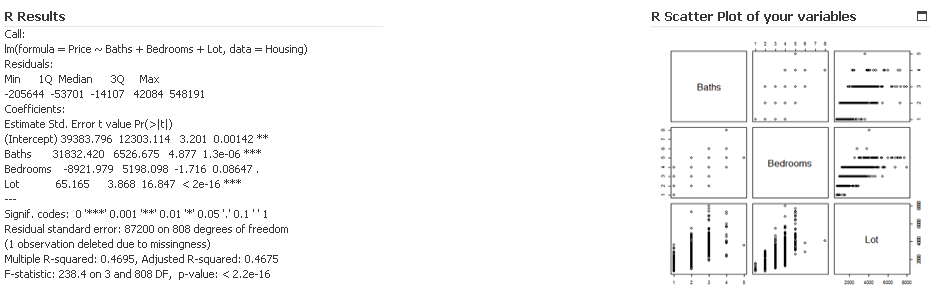
Behind the scenes there are only a handful of lines of vbscript code behind the button that says “Run in R.” Basically it outputs the data from a table so that whatever you have filtered is put into a CSV type file. Then it calls R tells it to read the file it just output, then tells it to run the LM function using the variables you’ve checked and asks it to output the results to a file and then reads that data back in to QlikView so you can see the results. Including a scatter plot output showing relationship between all of the variables.
Closing
Some aren’t even aware that QlikView integrates with R. Others that do know figure “I’m going to do the modeling in R anyway and figure there really isn’t much that the QlikView integration can do for them.” Hopefully both types of people end up stumbling on this post. Feel free to nudge them by passing on the link. You see the beauty isn’t just that QlikView can call R. It isn’t just that you can check variables on a screen. You are more than free to write additional code that would literally iterate through every potential combination, and instruct R to write the results to filenames that match the combinations so that in 1 button press you get all of the results for all combinations.
So what? So what!!! The “so what” here is that so many of you out there are thinking “data scientists are seriously expensive and we can’t afford them in our company.” You are so right. You can’t afford to pay a data scientist full time to sit and iterate through every combination of your data. After all housing variables are mere child’s play compared to the massive amount of variables in healthcare for instance.
But you can afford to consult with one. You could have them build a model and then you simply use QlikView to iterate through all of the variables and then send them the output to review. Or what about that grad student in data science who has a few days in which to get some “real world experience” would QlikView’s integration to R allow you to take advantage of them?
Predictive Analytics is an important part of the overall data consumption continuum. The integration and what QlikView offers you sitting on top of R may be just what your organization needs to jump start your ability to reap huge rewards that predictive analytics offers.
As for me, it was fun using house flipping as a great use case to help me convey how to use predictive analytics. As you guessed though it turns out that $12 isn’t even enough to buy a gallon of paint to slap on walls. So I guess I’ll just have to continue doing what I love … helping others consume data.
Resources for those hungry for more
You know how this blogging stuff works. If I write to much then I lose my audience. But in this case I know that flipping homes is really on the minds of a lot of you. So I’ve tried to predict some of your questions and provide you with links to more detailed answers and opportunities because that’s just the kind of dork I am.
“I want to see more so I can get a better idea of just how cool this stuff is”
The following You Tube video is a Qlik Dork exclusive and will probably not go viral so you shouldn’t have any problems at all viewing it. https://youtu.be/jwZ1K6invPI
“No fair having all of the fun yourself. I want to be a house flipping phenom as well. How do I get my hands on this stuff?”
Great question. You can download the QlikView application used, as well as an implementation guide to help you configure R on your machine by clicking this link when prompted the password is “PredictiveAnalytics”
“I am somewhat familiar with R and I really do have an interest in house flipping. How can I get more information about the subjec?”
I’m not a data scientist, I don’t play one on TV and I haven’t even stayed at a Holiday Inn Express recently. However, the following links will give you all of the information you need about how to do a multiple regression on home sales data and how to read the results. They are from the serious data science minds at Columbia.
Summary version to wet your whistle
Really complex document that will blow your mind if you aren’t really into statistics