
Avoiding a Data Tornado

You know I love to go out on a limb using data metaphors. Sometimes they are my own and sometimes I flat out steal them from others. (Imitation is the sincerest form of flattery you know.)
I’ve wanted to continue my series on The Data Consumption Continuum for a few weeks now. But just writing my thoughts? That’s crazy. I’ve had to show great patience in waiting for just the right metaphor to come along to catch your attention and draw you in. The “what in the world is Qlik Dork up to now” kind of lead. Recently inspiration struck as I came across this beautiful data metaphor “Data Tornado” from Tyler Bell.
In his post “Big Data: An opportunity in search of a metaphor” he introduces the concept as one of the major thought processes that surrounds data consumption in this great big data world we now find ourselves. He frames data as a problem of near-biblical scale, with subtle undertones of assured disaster if proper and timely preparations are not considered. (Don’t worry it’s not all doom and gloom he also introduces several positive metaphors but hey read those on your own time I’m trying to make a point here.)
We are at an age in the history of information where many analysts and businesses are begging for Self Service. Screaming if you will at IT “Just give me access to the data it belongs to the company I’m tired of waiting for you to write a report.” They are savvy and they know full well that the data is just sitting in a database or on a file share somewhere so why can’t they have access to it?
So why doesn’t IT want to just turn over the data and stop listening to the griping? Because the IT leadership team is worried about the Data Tornado that will ensue from all of these yahoos just randomly grabbing data and reporting 18 versions of the truth. You wondered where I was going with it didn’t you? And who can really blame them. You immediately understood the term “18 versions of the truth” because you’ve been burned by it in the past … multiple times.
 You can’t get any more succinct than Zach and Chris Gemignani in their book “Data Fluency” — “You can’t dump data into an organization and expect it to be useful. Creating value from data is a complex puzzle; one that few organizations have solved.” The answer to why not is found partly in another of their excerpts “The goal of a data fluent culture, in part, is to ensure that everyone knows what is meant by a term like customer satisfaction. A data fluency culture breaks down when people spend more time debating terminology, calculations, and validity of data sources rather than discussing what action to take based on the results.”
Enter Governed Self Service
Rest easy my friend. My post isn’t about the wide spread panic currently surrounding “self service” and that terms association with a “data tornado.” It’s about how to AVOID it. It’s about a new phrase you should repeat to yourself in the mirror a few dozen times until you begin believing your own facial expressions when you say it “Governed Self Service.”
The word “governed” seems to have negative connotations by many and those thoughts need to change. It doesn’t (have to) mean that IT is restricting you from accessing data. It can and should mean that IT is adding value to the data to ensure that the right data is used by the right people at the right times. They don’t want to be storm chasers or fire fighters dealing with the carnage after a data tornado has struck. Data Governance is a way for them to prevent the tornado in the first place by ensuring that you fully understand what you are surfacing.
Enter Qlik Sense
Self Service is a technology agnostic term. Many high quality tools are in the market that allow you to display data. Qlik Sense goes beyond the ability to display data and allows you to build in the governance that is so desperately needed to avoid data tornadoes and satisfy the well phrased concerns needed for a truly data fluent organization through the use of pre-defined Dimensions and Measures.
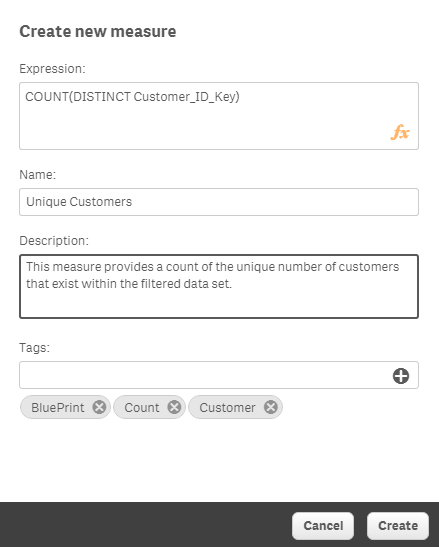
Imagine that we have a set of data that surrounds customers and the analyst needs to display a count of the customers. Easy enough … after we define what the term “customer count” means. If we are just looking at table that has customer demographics the count is obvious. But what if we are looking at a table of data that is all of the customer orders. Is the count the literal count that 100 customer (orders) were placed or should we display the unique count of customers so that we know we only had 76 different customers that placed those 100 orders?
Dimensions and Measures allow IT to build a framework of understanding to help analysts surface data in a way that avoids confusion. This screen shot illustrates how much metadata IT can add to a measure that can be used by an analyst in a way that ensures they use something as simple as a count correctly. You will see that the measure can contain a name, it shows the expression, it contains a description and holy cow it can even have tags associated that analysts can search for desired measures in a world where there might be thousands.
Enter Architeqt
As I’ve literally crisscrossed the country this year presenting to potential (and existing) Qlik customers they love this concept. But many in IT have begged for even more governance. “Dalton that’s great but Dimensions and Measures are only defined within single applications. What happens if we make changes? How can we apply changes across all of the applications? What if we need to add more as we develop more sources of data? After 30 years in the IT trenches I can do nothing but whole heartedly agree with them because maintenance is one of those things that IT considers but many analysts don’t.
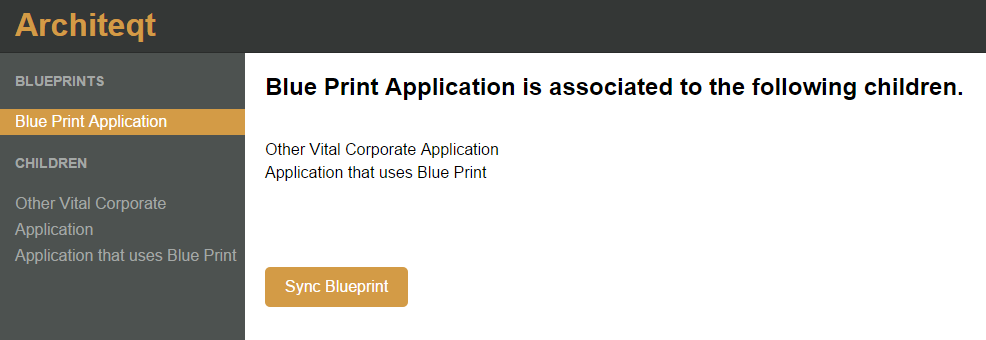
No problem because that’s where Architeqt comes in. Architeqt is the framework for providing serious data governance across all of your Qlik Sense applications and is the brain child of Alexander Karlsson. It provides you the ability to create what he calls “Blueprints” which are the dimensions/measures/visuals that you need to share across all of your applications and then … oh this is so cool … use those blueprints in any of your Qlik Sense applications. And keep them in synch when you make changes.
There are many very small incremental steps that I’ve seen in my career. But my hat goes off to him because Architeqt isn’t one of those things. To me what Alexander has created provides the infrastructure that IT has been clamoring for. It provides them the assurance that they can maintain all of those vital formulas across all of the applications while still allowing analysts to freely access data. Combined with the ease of use of Qlik Sense provides to analysts to grab data and go forth with consuming data it finally provides a framework for … say it with me … Governed Self Service.
Exit Stage Right
While I would love to go and on with lots of additional information I know this is the right time for me to step off the stage and allow you to dig into Architeqt for yourself. Simply click this link and it will take you directly to this phenomenal new extension. The site will contain all of the information you need to download and configure this Qlik Sense Extension as well as a nifty You Tube video where you can see it all in action.