
Visualizing Data at REST

My boy Sir Isaac Newton is famous for a few laws he wrote about motion. His first such law on the topic says:
An object at rest will remain at rest unless acted on by an unbalanced force. An object in motion continues in motion with the same speed and in the same direction unless acted upon by an unbalanced force
Apparently back in his day motion was not only a big deal but it was also apparently out of control and needed to have some laws written to govern it. If I lived back then I would have been mad about apples falling on my head as well and probably would have come up with some pretty awesome laws of my own.
But the Qlik Dork is living in a day and age where 0’s and 1’s are falling out of the sky and totally are totally out of control. Not sure there is any governing body to prevent me from doing so therefore I figured it was time for me dictate a few Laws of Data:
Qlik Dork’s First Law of Data – “Data at REST is stupid. Put that data into motion by visualizing it and your company will pick up momentum.”
Qlik Dork’s Second Law of Data – “Data at REST is expensive. Put that data into motion by visualizing it and the data will start paying for itself.”
Qlik Dork’s Third Law of Data – “Data at REST is useless. Unless you expect an 8’th day of the week to be added to the calendar I’ve got bad news for you … your ‘Someday’ won’get here. So start making use of your data ‘Today.'”
BIGger DATA
Big Data is kind of old news. How old? Even I jumped on the bandwagon all the way back in September of 2016. In this post I’m not going to talk about Big Data instead as the heading suggests I’m going to write about BIGger DATA.
Marketing slides would say that Qlik has 10 points of integration with Cloudera. Woo-hoo. You can actually get the value out of all that Big Data with Qlik. But those of you reading this blog aren’t novices. You already know that Qlik is a data ingesting beast and already knew that Big Data is simply another source of data. Qlik’s Associative Model will gladly allow you to associative your 0’s and 1’s from cocktail napkins, spreadsheets, flat files, databases, EDW’s and of course Big Data sources.
Kind of crazy that I can actually make light of that point, but let’s face we already know that. Nothing new to look at there. Where I’m going today is beyond even that. I’m suggesting that the data Cloudera collects about your ingestion of Big Data is also a source of meaningful data which is now just sitting at rest but can and should be visualized so you can get value out of it as well. In other words BIGger DATA.
Don’t laugh to hard but my use of the uppercase when using the word REST isn’t accidental. It’s intentional. What I’m driving at this post is using the Qlik REST data connector to take advantage of all of the data sitting there, at rest, about what you are doing with your Big Data. Sneaky huh??? That’s how I roll.
Visualizing Data at REST
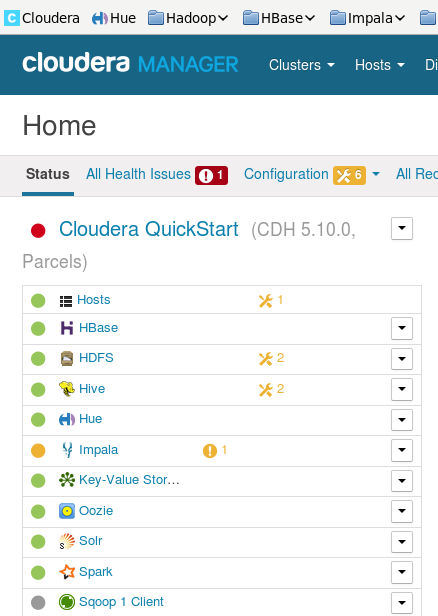
Let me lay the ground work for what I’m talking about. Cloudera provides a nice Cloudera Manager tool that you can utilize to see a lot of different things about your implementation. I can see what’s going across the system.
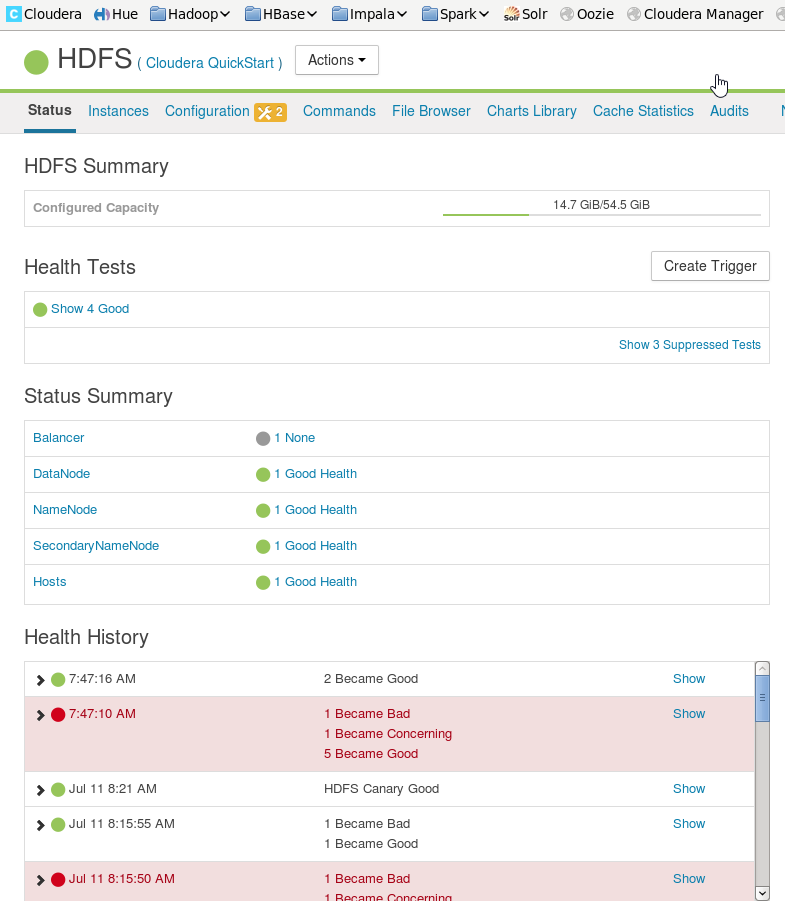
I can also drill into different systems to see what’s going on with them specifically.
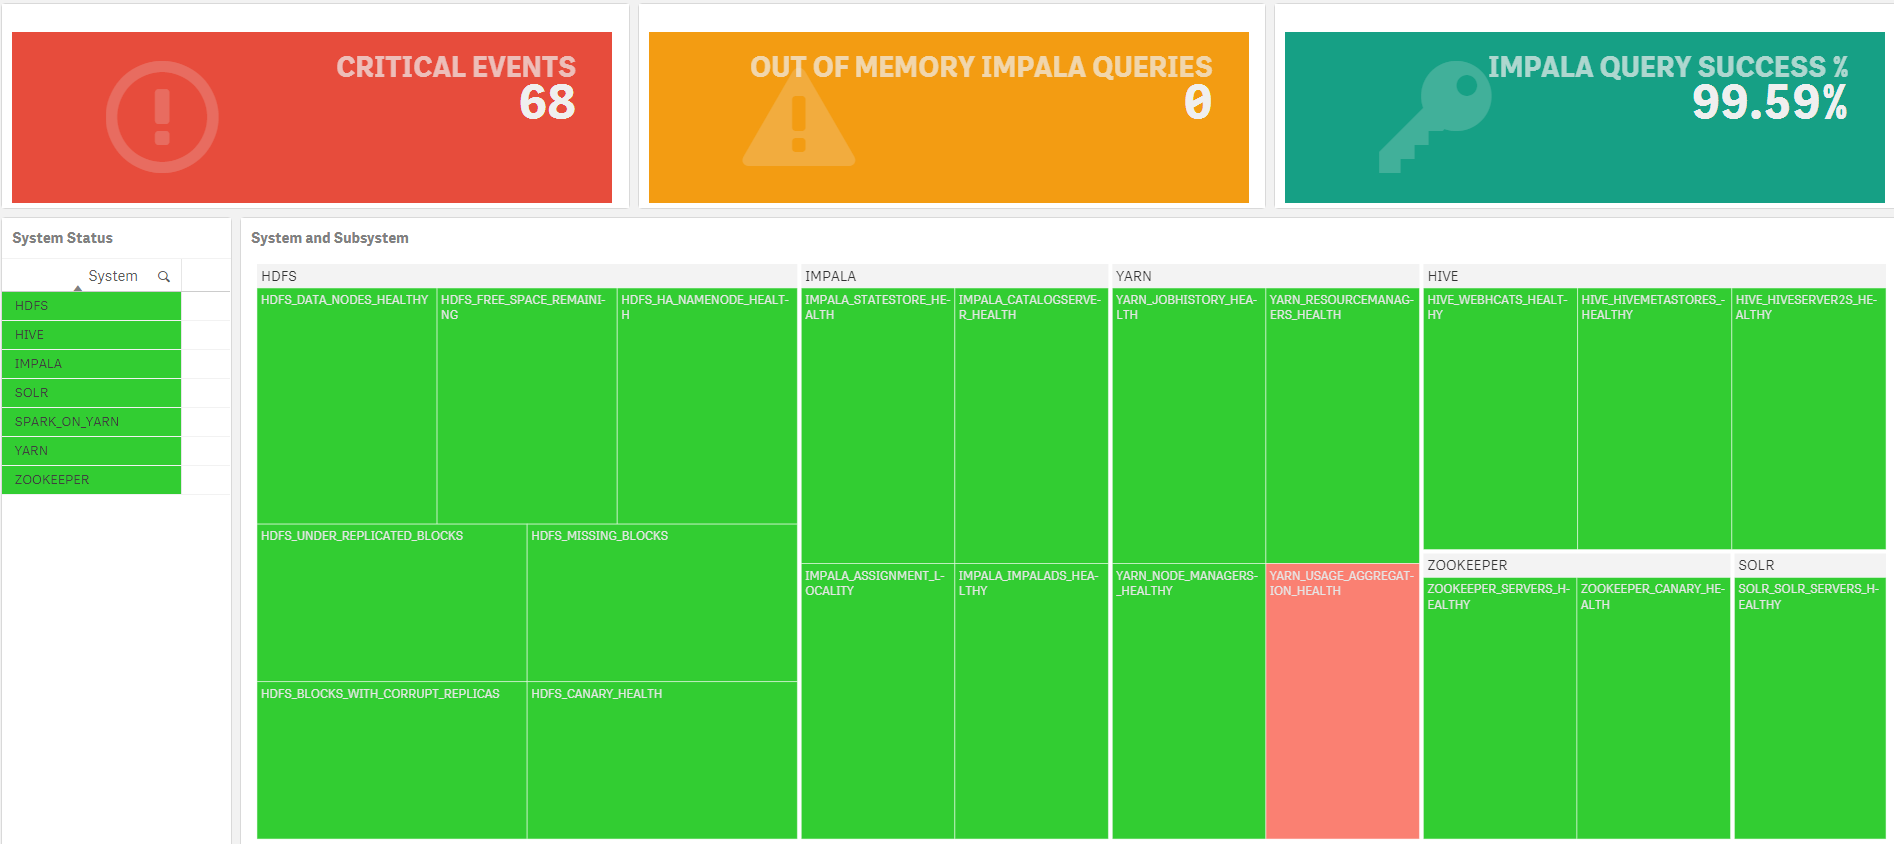
There is data behind those things. Meaningful. Important. Useful. Data. Visualizing all of that wonderful information inside Qlik provides you the ability to get an overall and subsystem visual as well:
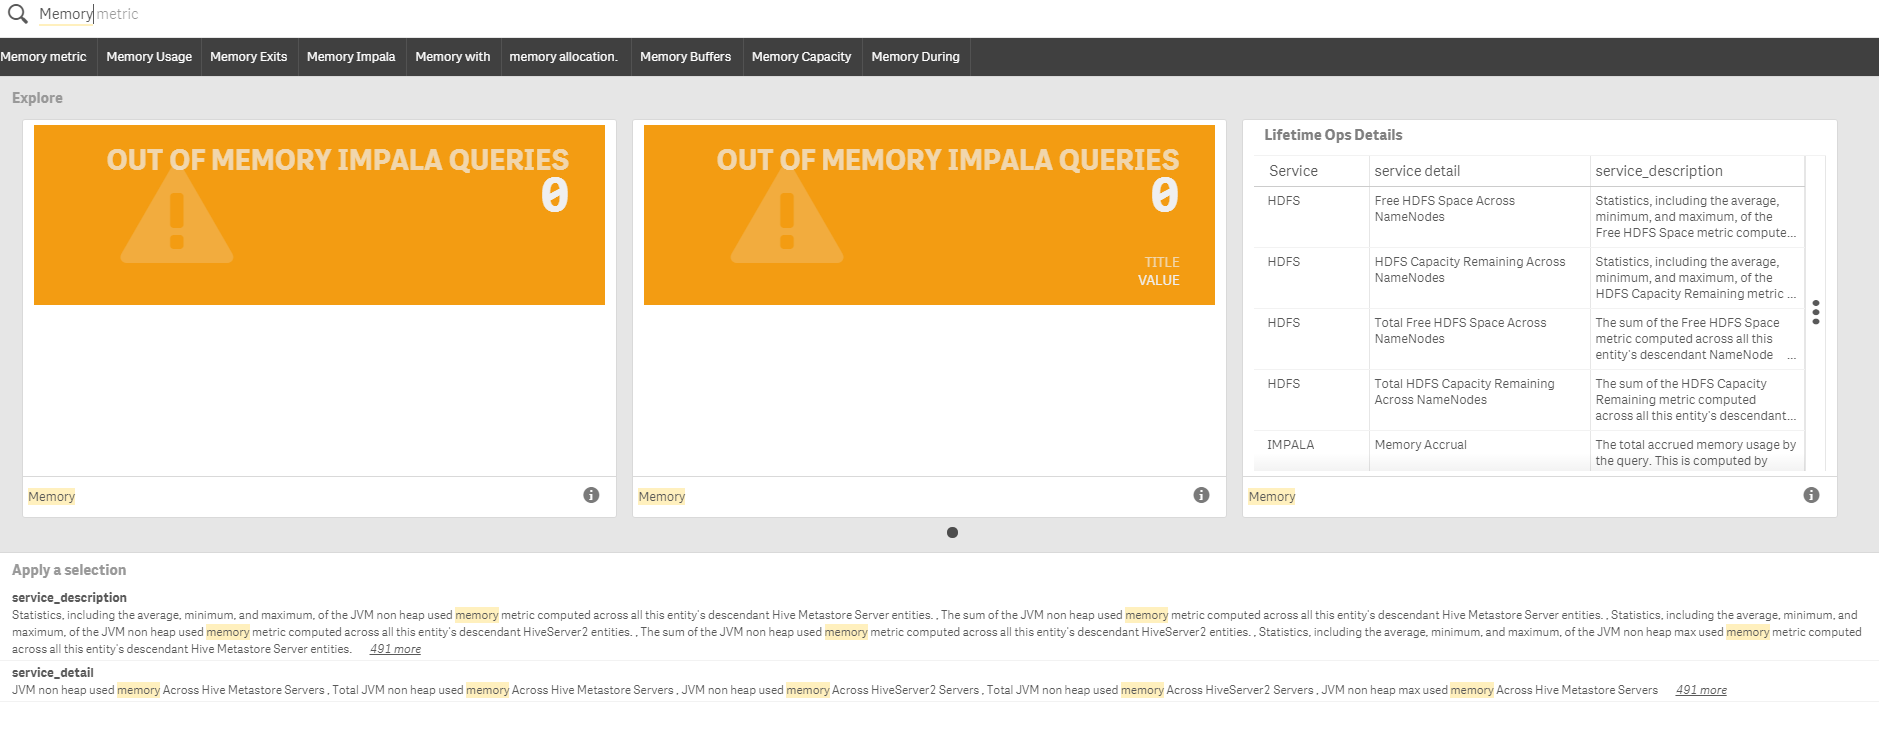
No big deal you say? Happy to click around and hunt and peck to find everything are you? Well how would you find any issues in any of the systems that have to do with memory or see their history? Well in Qlik I would simply use the Smart Search feature to find anything that has to do with the term “memory” but that’s just me.
What about the metadata collected about the queries that are used to pull the Big Data? Doesn’t have value? OF COURSE IT DOES so you know I want to visualize that as well. Not only can we show you which queries were fired and how many times they were fired, we can show a distribution plot of how long the queries took each time. Glad I was the guy who selected “Hello World” in 18 ms and not 5.5 minutes. Hate to be that guy.
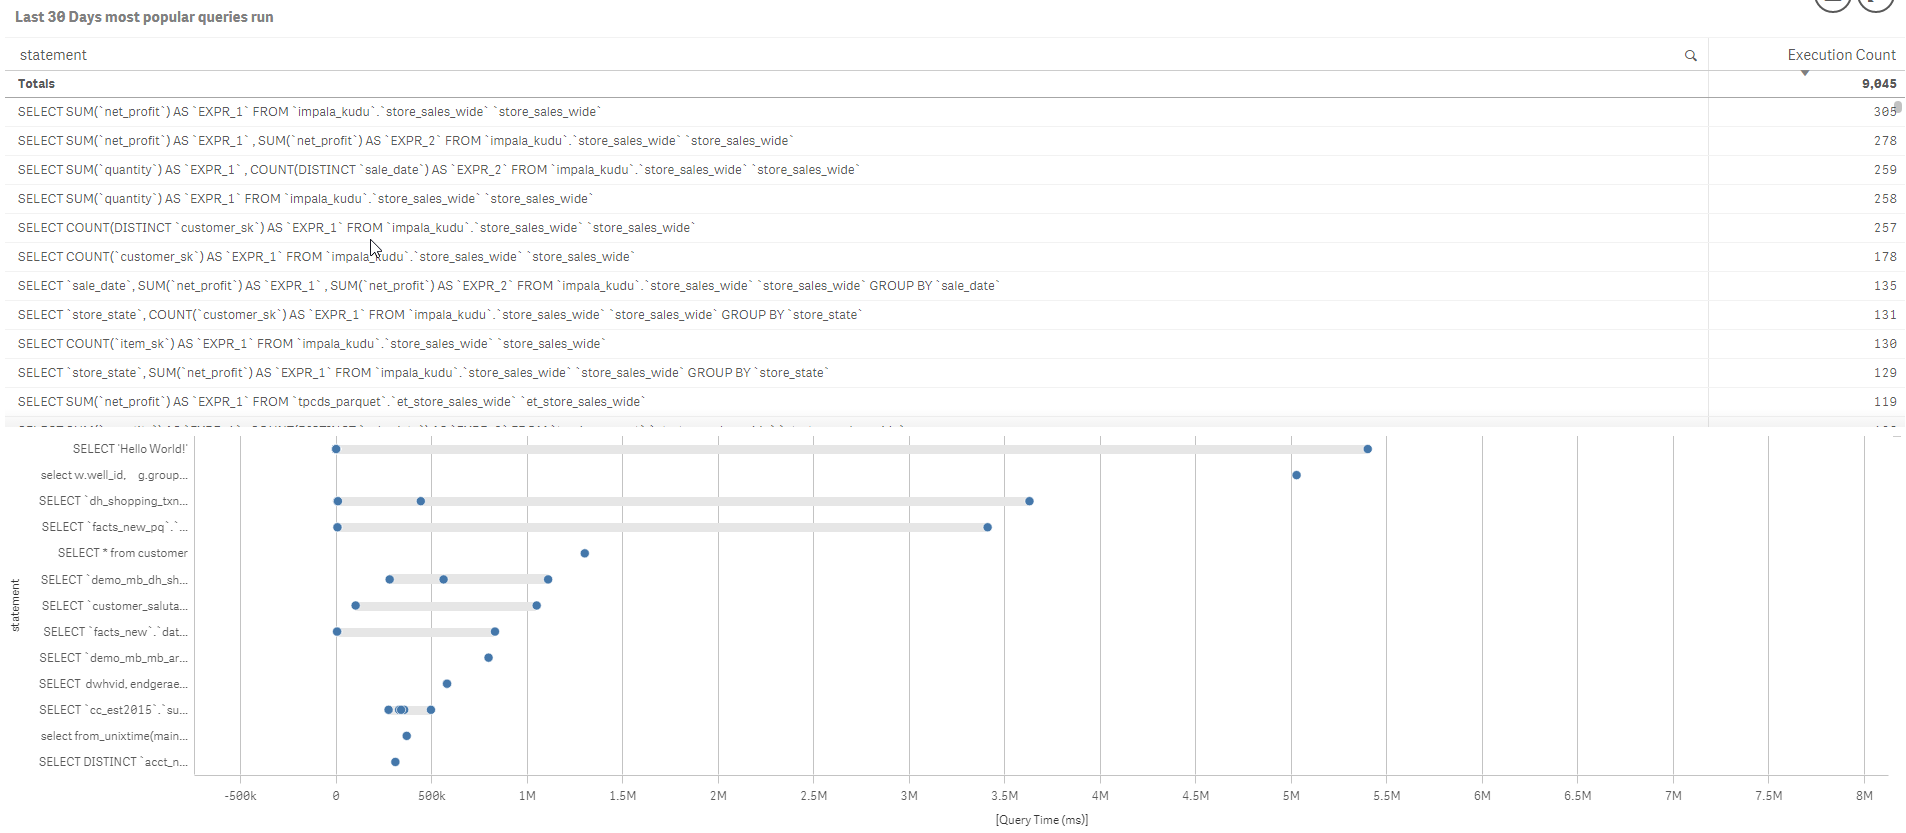
More importantly I’d hate to be the team that is just leaving all this data lay at rest on your system. If you don’t understand why… see my 3 Laws of Data above.
Using REST to get your data at rest about your Big Data usage
I’d like to begin this section by sharing that all of the real work in coding that you will see was done by my buddy, and Cloudera implementation stud David Frericks. Yes, there are others at Qlik that are bigger data dorks than I. And David is the guy the Qlik Dork goes to.
Did you even know that Cloudera had a fully supported set of REST API’s that could be used to pull this wonderful data that is only resting as of now? Guessing the answer is no or it would be redundant to write the question. You can check it all out right here.
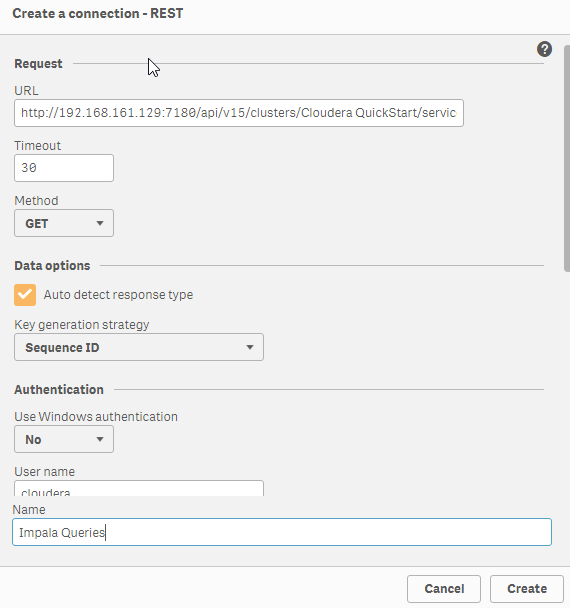
Let me walk you through a very simple REST API call. Let’s say we want to get all of the Impala queries that were run on the system. There is a REST API for that.
http://your_VM_IP_here:7180/api/v15/clusters/Cloudera QuickStart/services/impala/impalaQueries?from=2017-01-01&limit=1000&offset=0
We would implement that call using the Qlik Rest Connector like so. Notice that I’ve filled in my Cloudera system IP address and put my Cloudera system credentials in.
That will then allow me to see what that REST API call will surface in terms of data.
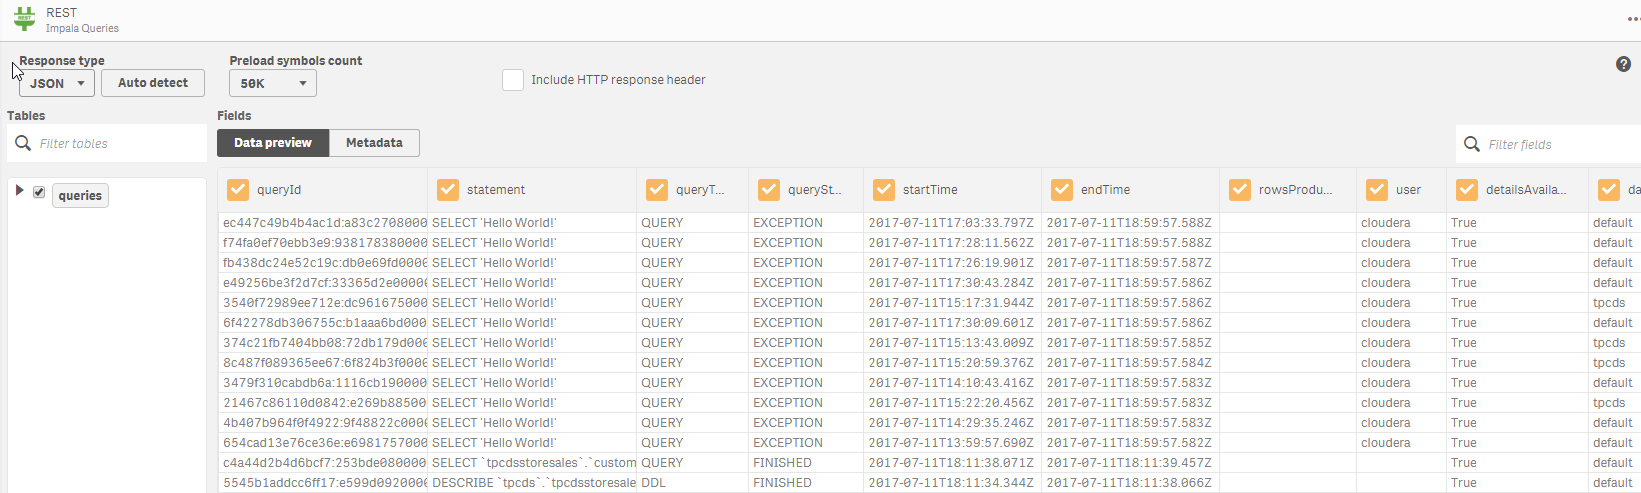
I say heck yeah, go get that for me … and boom it loads that data. It’s important to understand what’s happening behind the scenes at this point. Script is written that will execute and process that call.
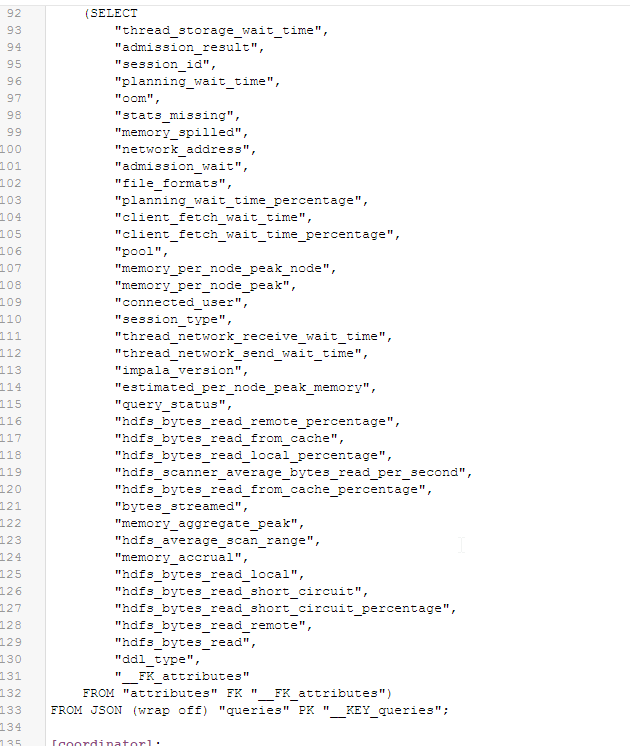
Phooey you say? TMI you say?
No my friends here is where the rubber meets the road … with script you can overcome any kind of REST API barriers that may exist with Cloudera or with others … say those pesky times when they implement a MAXIMUM number of rows being returned.
Qlik can loop and get all of the rows for you. But wait there’s more.
What about those times where you have 1 REST API call that returns some key information and you then need to go get the details using another REST API call? Or when you have multiple systems implemented and want to get all of the information about the systems, the calls that were fired, their history, their blah-blah-blah-blah. Yeah Qlik let’s you do all of that because of it’s ability to do the ETL on the fly.
When I started the section with a shout out to my friend David Frericks it wasn’t in jest. Dude provided a serious baseline of work in making the Cloudera REST API’s fly information and has produced some great work.
Follow up
“Hope isn’t a Strategy.” I read that recently in a book called “Wintality” by Baylor Barbee and that it was an awesome quote to summarize what I see happening right now in most people when it comes to big data. Lot’s of HOPE. They are hoping that the time will come when they will learn, understand, begin diving into “Big Data.” I’m assuming that you are reading this post because you are the kind that is more action oriented and you have or are formulating you strategy for visualizing your Big Data and hopefully now your Big’ger’ Data as I’ve laid it out for you.
Be sure to check out http://cloudera.qlik.com/ to see some great examples of how Qlik brings Big Data to life.
Hungry for even more? Want to see a phenomenal example of how Qlik can call SOLR Search on the fly using the REST API, ingest the data and produce a web application using the Qlik Sense Visualization API calls then check this out. http://cloudera.qlik.com:3000