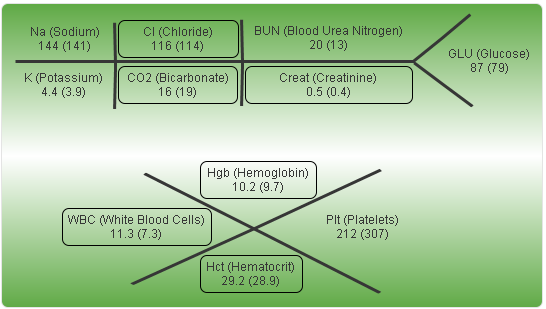
Visualizing Lab Results : Fishbone Diagram for Lab Results January 7, 2015 DaltonRuer Classic fishbone diagram for Visualizing Lab Results Using a fishbone diagram allows you to cleanly provide an expected location for your physicians for the key lab result values ← Previous Image Next Image → Leave a Reply Cancel replyYour email address will not be published. Required fields are marked *Comment * Name * Email * Website Type in the text displayed above Δ This site uses Akismet to reduce spam. Learn how your comment data is processed.